

Is new construction crushing Atlanta home values, or quietly making them stronger?
Local sales data from 2018-2024 shows a clear pattern: active building often nudges nearby resale prices down (roughly -2% to -8%) while the market absorbs inventory, then values usually rebound in 2-5 years.
Over five years and beyond, neighborhoods that gain real amenities, like parks, shops and better streets, tend to outpace baseline trends by about 3% to 12%, so the key question is whether a project substitutes for or complements the neighborhood.
Key Market Effects of New Construction on Atlanta Home Prices
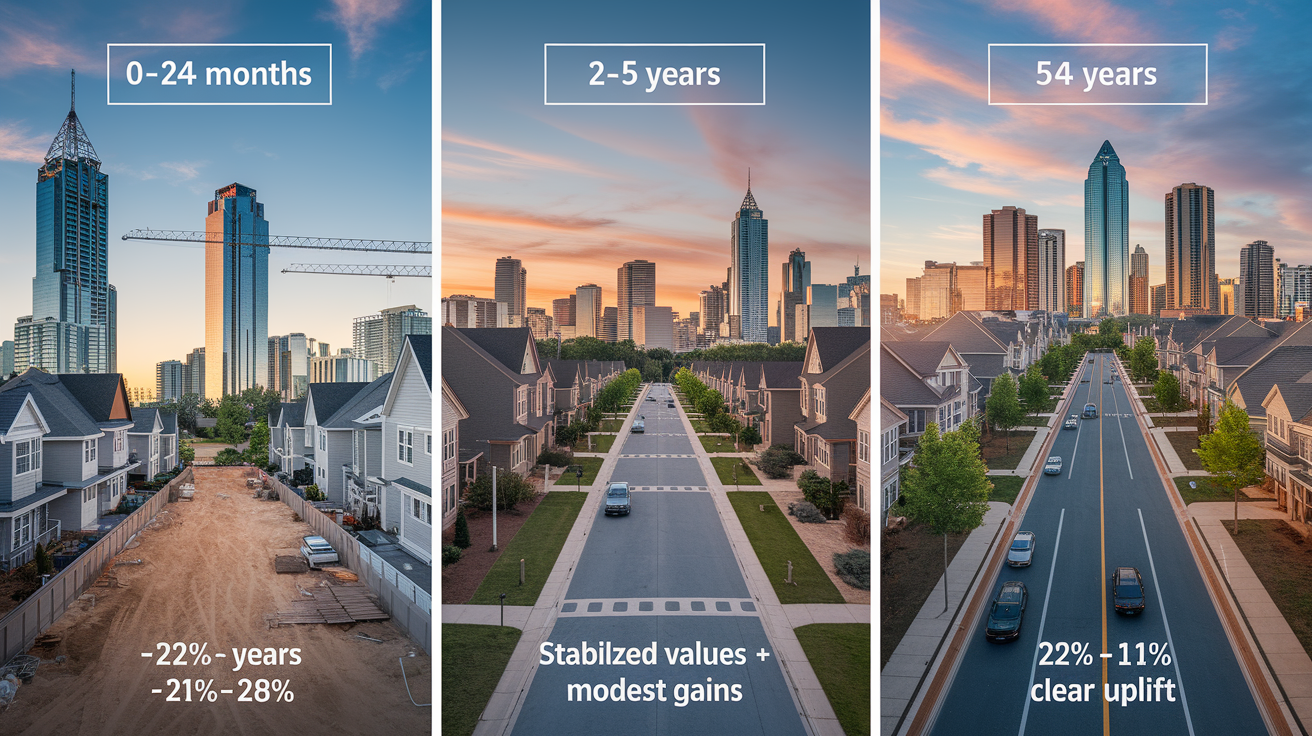
New construction in Atlanta shifts home prices through three distinct time windows. In the first 0 to 24 months while building is active, immediate neighboring resale properties commonly see price adjustments between -2% and -8%. During the medium window of 2 to 5 years after completion, values typically stabilize and return to parity, with many neighborhoods showing modest gains of 0% to +5%. Over the long term, 5 years and beyond, neighborhoods benefiting from new amenities, improved infrastructure, or higher quality housing stock often see cumulative appreciation of +3% to +12% above baseline market movement.
These ranges reflect real patterns across Metro Atlanta from 2018 through 2024. The short term dip happens when buyers compare freshly finished homes with older resales next door. Medium term recovery occurs as construction wraps up, the inventory of new homes is absorbed, and the neighborhood settles. Long term uplift shows up in areas where new development brings better streetscapes, retail access, parks, or transit connections that raise demand for the entire neighborhood, not just the new homes.
Intown submarkets such as West Midtown, Old Fourth Ward, and Inman Park typically see new single family homes listed at $600,000 to $1.8 million, with townhomes and condos often in the $350,000 to $900,000 range. Suburban new construction in places such as Alpharetta, Johns Creek, and Smyrna commonly lists single family homes between $350,000 and $900,000, with higher end enclaves in Buckhead area suburbs reaching well above that band. These price points represent what builders ask, before incentives and negotiation.
Builders generally price new homes 5% to 15% higher than comparable older homes to account for warranties, modern finishes, and energy efficient systems. In practice, effective sale prices often narrow toward parity with upgraded resales once builders apply incentives. These incentives commonly range from $5,000 to $40,000 and may include closing cost assistance, rate buydowns, or free upgrades such as granite counters or appliance packages. The gap between list price and final sale price widens when resale competition is strong and builders need to move inventory faster.
Buyer Reactions and Neighborhood Dynamics During Active Construction

When heavy equipment, staging areas, and daily construction noise dominate a block, buyer perception shifts fast. Shoppers touring older homes adjacent to active sites often ask for price concessions, citing disruption, dust, street parking taken by contractor trucks, and uncertainty about the final look of the neighborhood. Even when the new homes under construction will be similar quality, the visible mess creates hesitation. That hesitation turns into negotiation leverage, and sellers of older homes nearby often reduce asking prices or offer credits to close deals.
Absorption windows, the time it takes to sell all units in a new phase, also shape buyer psychology. Most Atlanta new home projects absorb within 6 to 18 months. Luxury product can stretch to 12 to 36 months. When absorption slows, buyers see multiple unsold new homes sitting and assume they have leverage to negotiate. If new home inventory rises by 10% or more within a micro area over a 12 month span, price pressure on comparable older homes usually follows because the supply of “like new” alternatives increases faster than demand. Buyers then direct their offers toward the new builds or push resale sellers to compete on price.
Neighborhood turnover accelerates during active development. Longtime residents sometimes list early to avoid construction inconvenience, adding to resale inventory at the same time builders are listing new units. This double supply bump compresses prices until the new phase is absorbed and the block stabilizes. Once construction fences come down, landscaping matures, and the new neighbors move in, the short term drag typically fades.
Key signals that short term pricing pressure is building:
Permit activity surges. A sustained increase of 10% or more year over year in building permits within a neighborhood indicates supply is rising.
New home listing share climbs. When new construction represents more than 20% of active listings in a micro area, expect measurable impacts on resale comps.
Visible staging and site activity. The presence of multiple construction trailers, material deliveries, and daily crew activity lowers curb appeal for neighboring resales.
Price per square foot gaps widen. If new homes are priced more than 10% per square foot above older homes, appraisals may struggle and resale sellers face tougher negotiations.
Medium and Long Term Effects of New Construction on Atlanta Property Values

After construction wraps and the initial inventory is absorbed, typically within 2 to 5 years, property values in the surrounding area usually stabilize and begin to recover. The medium term phase sees prices return to parity with broader neighborhood trends, with many areas posting modest gains of 0% to +5%. The early discounts fade as buyers no longer factor in construction disruption, and the new homes become established comparables that anchor the neighborhood’s market value rather than dragging it down.
Long term appreciation, 5 years and beyond, often shows the strongest uplift in neighborhoods where new construction brought tangible improvements beyond the individual homes. New streetscapes, sidewalks, parks, retail storefronts, and transit access raise demand across the entire area. When a new mixed use project adds restaurants, coffee shops, or grocery stores within walking distance, older homes nearby benefit from the increased foot traffic and livability. Buyers pay more to live in a neighborhood that feels complete, walkable, and vibrant. Data from intown Atlanta neighborhoods shows cumulative gains of +3% to +12% over multi year horizons in areas where development included these amenity upgrades.
The key difference between medium and long term outcomes is whether new construction substitutes for existing homes or complements the neighborhood. Substitution happens when builders simply replace older homes with similar product on similar lots. Values stabilize but don’t jump. Complementary development happens when new projects fill gaps, add missing housing types such as townhomes for downsizers, or bring services the neighborhood lacked. In those cases, the entire housing stock appreciates because the neighborhood itself becomes more desirable, not just the new units.
Neighborhood Examples: How Atlanta Submarkets Respond to New Construction

West Midtown, Old Fourth Ward, and Inman Park experienced heavy infill development and mixed use projects from 2018 through 2024. During active construction phases, resale homes near building sites commonly saw short term price softness. Buyers hesitated while scaffolding and cement trucks dominated blocks. Over the long term, these neighborhoods posted some of the strongest appreciation in Metro Atlanta, with cumulative gains of +5% to +12% above baseline market trends. The new construction brought streetscape improvements, retail density, and better walkability. Older bungalows and renovated homes benefited as buyers paid premiums to live in revitalized, amenity rich intown areas.
Buckhead, Brookhaven, and Decatur saw a different pattern: luxury infill and teardown replacement projects. Builders purchased older ranch homes on large lots, demolished them, and constructed new estates or modern single family homes priced well above the neighborhood median. This trend often set higher comparable sales, moving neighborhood medians upward by several percentage points over 3 to 5 years. Short term impacts were smaller because the new product targeted a higher price tier and didn’t directly compete with mid market resales. Instead, the luxury builds anchored a new price ceiling, making upgraded older homes in the same area appear more affordable by comparison.
East Atlanta, Kirkwood, and West End experienced high volume entry level infill aimed at first time buyers. Builders added townhomes and starter single family homes priced to compete directly with renovated older stock. This created measurable short term pressure. Comparable older homes saw price adjustments of -3% to -10% until buyers fully valued the tradeoff between new construction warranties and the larger lots or unique character of older homes. Medium term recovery occurred as supply was absorbed and the neighborhoods stabilized, but the impact lasted longer than in luxury submarkets because the new product and older resales served the same buyer pool.
Suburban areas such as Alpharetta, Johns Creek, and Smyrna absorbed large master planned communities and new subdivisions. These projects increased local supply but often brought sustained demand through improved schools, retail centers, and employment hubs. The net effect on nearby resale values tended to be neutral to modestly positive, with cumulative impacts in the +0% to +6% range. Buyers moving to these suburbs prioritized new construction for modern layouts and warranties, but the scale of development matched demand growth, preventing the supply shocks seen in smaller intown neighborhoods.
| Neighborhood | New Construction Type | Typical Price Impact (Short Term) | Typical Price Impact (Long Term) |
|---|---|---|---|
| West Midtown / Old Fourth Ward / Inman Park | Mixed use infill, townhomes, single family | -2% to -8% | +5% to +12% |
| Buckhead / Brookhaven / Decatur | Luxury teardown replacement, estates | 0% to -3% | +3% to +8% |
| East Atlanta / Kirkwood / West End | Entry level infill, townhomes | -3% to -10% | 0% to +5% |
| Alpharetta / Johns Creek / Smyrna | Master planned subdivisions, single family | -1% to -4% | +0% to +6% |
How Builder Pricing and Incentives Shape Atlanta Home Price Trends

Builders set initial asking prices 5% to 15% above comparable resale homes to reflect warranties, modern appliances, open plan layouts, and energy efficient HVAC systems. This premium signals that new construction offers tangible value beyond square footage. When builders launch a new phase, they study recent resale comps and position their product slightly higher, betting that buyers will pay extra for the convenience of move in ready homes with no deferred maintenance. That strategy works in strong markets where inventory is tight and buyers compete for limited options.
In softer markets or when resale competition intensifies, builders deploy incentives to maintain effective pricing without officially cutting list prices. Common concessions include $5,000 to $40,000 in closing cost assistance, temporary mortgage rate buydowns, or free upgrades such as granite countertops, stainless appliances, or hardwood flooring. These incentives narrow the gap between new home pricing and resale comps, making the effective cost of new construction much closer to buying an upgraded older home. Appraisers see the final sale price after incentives, which means the inflated list price often doesn’t become the new comp ceiling. Actual closed sales drive valuations.
When builder incentives are large and frequent, nearby resale sellers feel the pressure. A buyer comparing a $500,000 resale home with a $515,000 new build that includes $20,000 in closing help and upgrades will often choose the new construction, forcing the resale seller to drop price or sweeten terms. This dynamic compresses resale values during periods of heavy builder activity, especially in neighborhoods where multiple phases are launching at once. The effect reverses once builder inventory is absorbed and incentives shrink.
Common builder incentives that shape Atlanta pricing trends:
Closing cost assistance. Builders cover $5,000 to $20,000 of buyer closing costs, reducing the cash needed at closing and making new homes accessible to buyers with smaller down payment reserves.
Mortgage rate buydowns. Temporary or permanent rate reductions funded by the builder, often lowering the buyer’s monthly payment by $100 to $300 for the first few years.
Upgrade packages. Free or discounted appliances, flooring, lighting, or landscaping, adding $10,000 to $40,000 in tangible value without changing the list price on paper.
Construction Costs, Supply Conditions, and Their Influence on Atlanta Home Prices

Building a new 2,000 square foot home in Atlanta costs around $395,000 according to recent data, compared to buying a comparable existing home for approximately $364,868. That roughly $30,000 premium reflects the expense of land acquisition, permitting, materials, labor, and builder markup. Land in Metro Atlanta averages about $30,000 per acre, though prices vary sharply by location. An acre inside I-285 in a desirable intown neighborhood can run several times that amount. Land preparation adds another $1,500 to $3,000 for grading, clearing, and utility connections before construction even begins.
Material and labor cost inflation from 2020 through 2023 pushed new home pricing higher and anchored resale values upward in many submarkets. When builders pay more for lumber, concrete, copper wiring, and HVAC systems, they pass those costs to buyers. Resale sellers benefit indirectly. If new construction lists at $400,000 because of high input costs, a comparable older home priced at $375,000 looks reasonable by comparison, even if that older home would have sold for $350,000 two years earlier. The floor under pricing rises as construction costs climb.
Permitting fees and timeline delays also influence pricing. Building permits in Atlanta typically cost $1,000 to $2,000, with additional permits for HVAC ($250 to $400), plumbing ($50 to $500), and electrical ($10 to $500) depending on county and scope. When permitting backlogs stretch project timelines, builders carry higher financing costs and pass those expenses into final pricing. Buyers see higher asking prices and often negotiate harder, compressing builder margins but keeping absolute prices elevated compared to historical norms.
For a detailed breakdown of what it costs to build from the ground up, including land, permits, materials, and systems, see “The ‘Real’ Cost to Build a Home in Atlanta”.
Key construction cost components shaping Atlanta pricing:
Land acquisition. Averages around $30,000 per acre. Significantly higher intown and near desirable school districts or transit.
Materials. Lumber, concrete, roofing, siding, and finishes fluctuate with commodity markets. Recent inflation pushed costs 15% to 30% higher than 2019 levels.
Labor. Skilled trade shortages (framers, electricians, plumbers) increase hourly wages and extend project timelines, adding indirect cost.
Permitting and fees. Building permits and inspections range $1,000 to $2,000+. Additional system permits add hundreds more.
Systems and appliances. HVAC installation ($1,500 to $12,500), plumbing fixtures (around $12,000), and full appliance packages ($10,875 to $24,400) represent significant line items that resale homes may need replaced, giving new construction a competitive edge.
Buyer and Seller Strategies When Competing With or Considering New Construction

Sellers of older homes located near active new construction phases often need to invest $5,000 to $25,000 in targeted updates to remain competitive. Fresh paint, updated kitchen hardware, new light fixtures, improved landscaping, and minor bathroom refreshes signal move in readiness and reduce the perceived gap between an older resale and a brand new home down the street. Spending $10,000 on cosmetic improvements can erase a 3% price discount in many intown comparables, turning a $400,000 home that might have sold for $388,000 into one that closes at asking price.
Timing the listing also matters. If possible, delay listing 6 to 12 months after a major construction phase completes. Once builder inventory is absorbed, fences and signs come down, and the new neighbors settle in, the short term pricing pressure fades. Selling during peak construction activity forces you to compete directly with builder incentives and freshly finished interiors. Waiting until the neighborhood stabilizes often means stronger comps and less buyer hesitation.
Buyers evaluating new construction should negotiate builder incentives aggressively, especially when comparable resale homes exist nearby. Builders commonly offer $5,000 to $40,000 in combined incentives, closing cost help, rate buydowns, or upgrade packages, when they need to move inventory. Ask for specifics in writing, compare the effective cost after incentives to nearby resales, and factor in warranties that reduce near term maintenance expense. Buyers should also demand full inspection rights and clarity on what the builder warranty covers, because not all warranties are equal.
Practical tactics for buyers, sellers, and investors:
Sellers. Invest $5,000 to $15,000 in kitchen and bath updates, fresh landscaping, and neutral paint to compete with builder finishes.
Sellers. Highlight larger lot sizes, mature trees, lower property taxes, and established neighborhood character that new builds on smaller lots can’t match.
Buyers. Negotiate closing cost credits, rate buydowns, or free upgrades worth $10,000 to $30,000 when builder inventory is high.
Buyers. Compare total monthly cost (mortgage, taxes, insurance, HOA) between new and resale after accounting for energy efficiency and deferred maintenance on older homes.
Investors. Model 6 to 18 month absorption windows and underwrite potential 1% to 4% short term value drag if planning to resell quickly near active construction.
Investors. Prioritize blocks where new retail, parks, or transit projects are planned. These signal stronger long term appreciation potential.
Market Indicators to Track When Evaluating the Impact of New Construction
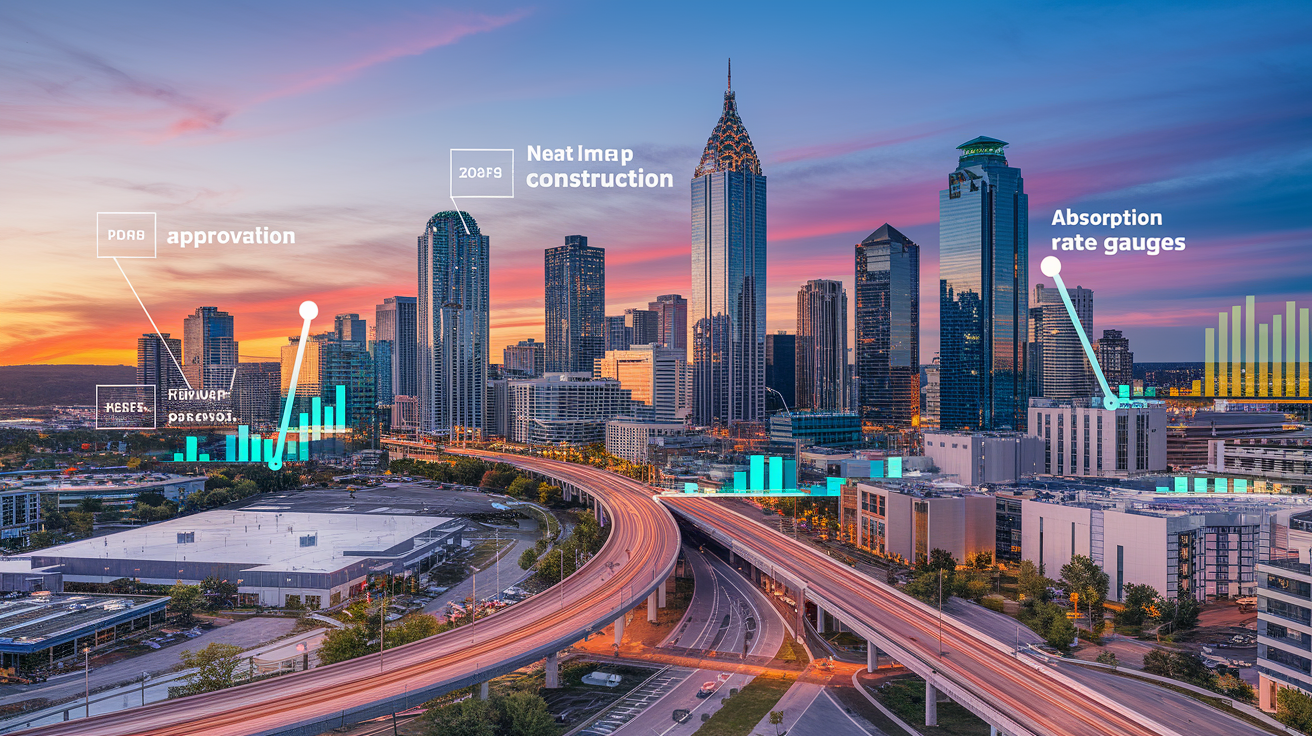
Building permit data is the earliest signal of supply shifts. A sustained increase of 10% or more year over year in residential building permits within a neighborhood indicates rising supply that will hit the market within 6 to 18 months. When permits cluster in a small geographic area, expect measurable impacts on nearby resale comps as new inventory is listed. Counties and cities publish monthly permit reports, and tracking these numbers helps buyers, sellers, and investors anticipate pricing pressure before it shows up in MLS data.
New home listing share is another key metric. If new construction represents more than 20% of active listings in a micro neighborhood, competition between builders and resale sellers intensifies. Buyers have more options, negotiation leverage increases, and prices compress until inventory normalizes. Price per square foot gaps also matter. When new homes are priced more than 10% per square foot above comparable resales, appraisals may come in low, forcing price adjustments or deal cancellations. Tracking these gaps over time reveals whether new construction is pulling comps upward or creating a pricing ceiling that resales struggle to reach.
| Indicator | What It Measures | Impact on Home Prices |
|---|---|---|
| Building permits (10%+ YOY increase) | Future supply entering the market within 6 to 18 months | Signals likely short term downward pressure on nearby resale prices |
| New home listing share (>20% of active inventory) | Current competition between new construction and resales | Increases buyer negotiation leverage; compresses resale pricing |
| Price per square foot gap (>10% new vs. resale) | Appraisal risk and pricing misalignment | Creates downward pressure on new home pricing or prevents resale comps from rising |
| Absorption rate (6 to 18 months typical; 12 to 36 luxury) | Speed at which new inventory sells | Slow absorption extends pricing pressure; fast absorption normalizes values quickly |
Final Words
In the action, we mapped short-, medium-, and long‑term price bands: a small near-term dip, a 2–5 year normalization, and possible long‑run gains where streetscapes or retail improve. That gives a quick, numbers-first view of what to expect.
We also compared intown versus suburban ranges and noted common builder pricing and incentives. Watch local indicators and the impact of new construction on atlanta home prices, plan your timing, and you’ll be ready to make a smarter move.
FAQ
Q: Are house prices going down in Atlanta?
A: House prices in Atlanta are mostly mixed: some intown and high‑inventory pockets show short‑term softness, while many suburbs remain stable or rising; check local inventory and recent comps for your neighborhood.
Q: Is $90,000 a good salary in Atlanta?
A: Earning $90,000 in Atlanta is generally above metro median and typically affords a comfortable lifestyle for one or two people, though affordability depends on mortgage, OTP commute, and family size.
Q: Are new construction home prices dropping?
A: New construction home prices are softening in some Atlanta micro‑markets, especially where supply rose; builders often still price 5%–15% above resales but offer $5k–$40k incentives, which narrows effective prices.
Q: What is the real estate outlook for 2026 in Atlanta?
A: The 2026 real estate outlook for Atlanta is cautiously mixed: expect stabilization in 2–5 years, stronger gains in neighborhoods with new amenities, and outcomes tied to inventory, absorption rates, and mortgage movements.