

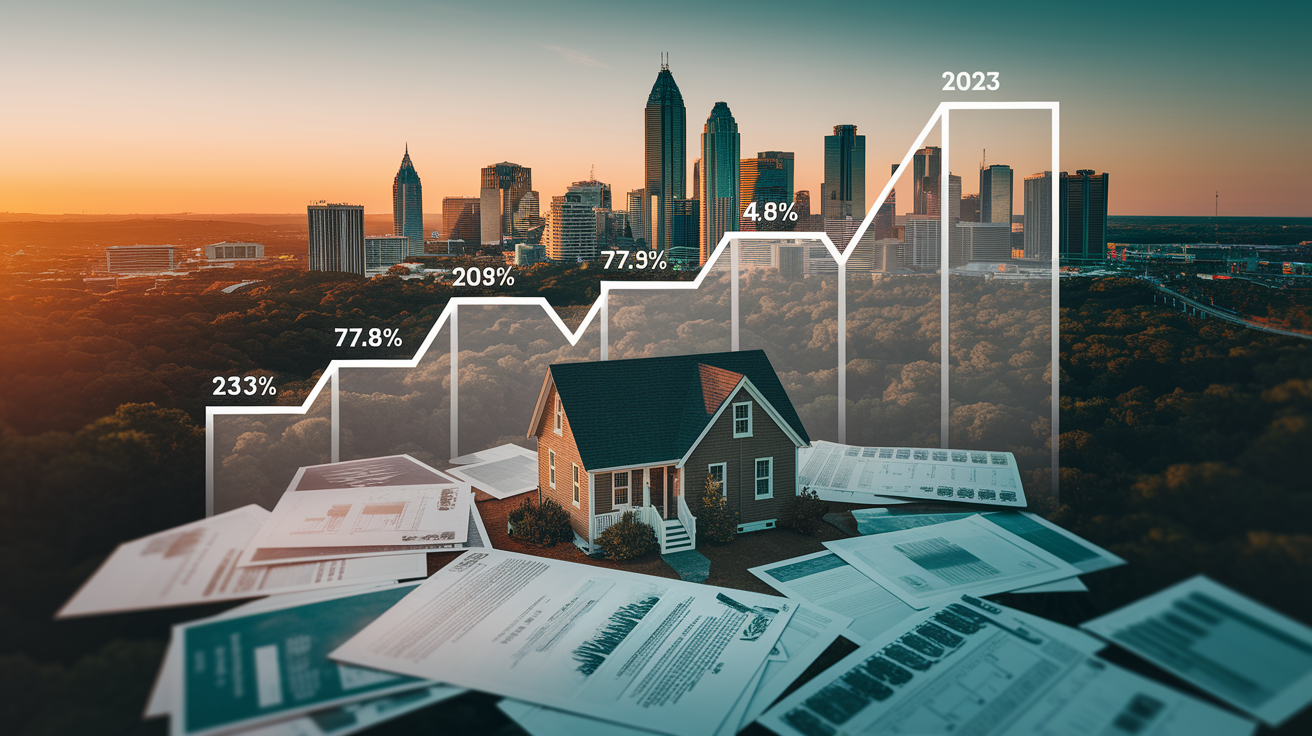
Did you know Atlanta’s 30‑year fixed (the standard long‑term mortgage) swung more than five percentage points over the last decade?
We went from mid‑4% in 2014 down to pandemic monthly lows around 2.65% in early 2021, then to monthly peaks near 7.79% in late 2023.
That swing changed monthly payments on a typical $350,000 home by roughly $500 a month at the extremes.
This post breaks down monthly and yearly data, compares Atlanta to national averages, and gives practical steps for buyers and refinancers across Metro Atlanta, inside I‑285 and OTP, so you can plan your next move.
Atlanta Mortgage Rate Timeline Overview (2014–2024)
Atlanta’s mortgage rates swung wildly over the past decade. We went from mid‑4% territory in 2014 down to pandemic lows near 3% in 2021, then rocketed past 6% when the Fed started tightening. If you shopped for a home or refinanced during this stretch, you lived through two brutal cycles: a slow drift into the cheapest borrowing costs in history, then one of the fastest rate spikes we’ve ever seen.
Monthly extremes tell you more than annual averages ever will. The lowest 30‑year fixed monthly average Atlanta lenders posted sat around 2.65% in February and March of 2021. Before COVID, nobody believed you could lock a 30‑year mortgage under 3%. By early 2021, the rate was cheaper than a used‑car loan. On the other end, October 2023 pushed Atlanta’s 30‑year average up to roughly 7.79%. That’s a 5.14 percentage point swing from bottom to top. Same $350,000 home, but your monthly payment jumped from $1,500 to $2,000.
| Year | 30‑Year Avg | 15‑Year Avg |
|---|---|---|
| 2014 | 4.17% | 3.41% |
| 2015 | 3.85% | 3.20% |
| 2016 | 3.65% | 2.97% |
| 2017 | 3.99% | 3.23% |
| 2018 | 4.54% | 3.99% |
| 2019 | 3.94% | 3.27% |
| 2020 | 3.11% | 2.45% |
| 2021 | 2.96% | 2.30% |
| 2022 | 5.09% | 4.28% |
| 2023 | 6.71% | 5.80% |
| 2024 | 6.45% | 5.65% |
Atlanta’s decade of rates moved through three waves. First came gradual normalization from 2014 to 2018, then a brief dip in 2019. The pandemic hit in 2020 and drove rates into the basement through 2021. After that? A sharp post‑pandemic spike that peaked in late 2023, then eased slightly in 2024. Atlanta tracked national averages closely the whole time, usually within 0.10 to 0.20 percentage points. That spread came down to local lender pricing and borrower credit mix, not any real regional premium. For context on how Atlanta’s rates sit within broader Georgia Mortgage Rates, statewide averages show similar patterns with almost no spread across metro areas.
Year‑by‑Year Atlanta Mortgage Rate Breakdown and Market Context

The first half of the decade looked like a slow climb back from crisis‑era emergency policy. 2014 through 2018 saw the Fed gradually raising its short‑term rate, bond yields drifting higher, and mortgage rates inching from the high‑3% range in 2015 and 2016 back toward mid‑4% by 2018. Buyers during those years got rates that felt manageable by historical standards. But there wasn’t any urgency, no clear low‑rate window to rush through.
2019 brought a short reprieve. Slowing global growth and lower bond yields pushed Atlanta’s 30‑year average back down to 3.94%. Then the pandemic arrived. The Fed slashed its policy rate to near zero and started buying bonds by the truckload, driving Atlanta’s 30‑year average to 3.11% in 2020 and 2.96% in 2021. Those were the lowest sustained borrowing costs in modern mortgage history. Monthly averages dipped under 2.7% for a brief window, which set off refinancing surges and let buyers afford higher‑priced homes with the same monthly payment.
The reversal came fast. Inflation exploded in 2021 and 2022, and the Fed responded with the most aggressive tightening cycle in four decades. By the end of 2022, Atlanta’s 30‑year fixed average had more than doubled from its 2021 low, landing at 5.09% for the year. Tightening continued into 2023. The 30‑year average hit 6.71%, and monthly peaks touched nearly 8%. That shift cooled Metro Atlanta’s red‑hot purchase market, stretched out listing times, and pushed some buyers toward adjustable‑rate mortgages or bigger down payments to keep monthly costs under control.
By mid‑2024, inflation had softened and long‑term bond yields declined a bit, pulling the 30‑year average back to 6.45%. That’s a partial retreat from late‑2023 highs but still way above the pandemic lows. Local Atlanta dynamics amplified these national swings. Strong population and job growth kept housing demand elevated even as rates climbed. Inventory constraints meant buyers couldn’t easily wait out rate cycles, so every percentage‑point change translated directly into bidding behavior and affordability ceilings.
Key Turning Points in Atlanta’s Rate Decade:
- 2020–2021 Pandemic Lows: Monthly 30‑year averages fell to around 2.65%, driving record refinancing and purchase activity.
- 2022 Spike: Rates doubled in less than 12 months as the Fed raised policy rates seven times, pushing 30‑year averages above 5%.
- 2023 Peak: October 2023 saw 30‑year rates near 7.79%, the highest monthly average of the entire decade.
- 2024 Stabilization: Rates hovered in the mid‑6% range through the first half, reducing volatility but keeping monthly payments way above the sub‑3% era.
Atlanta vs. National Mortgage Rate Comparison Across the Last Decade
Atlanta’s mortgage rates moved almost in lockstep with national averages throughout the decade. You rarely saw more than 0.10 to 0.20 percentage points of difference. That narrow spread reflects how mortgage pricing actually works. Lenders base rates on national bond‑market movements and secondary‑market investor demand, so local variations come down to borrower credit profiles, loan competition, and small regional adjustments.
Looking at the broader national timeline confirms Atlanta’s position. According to Mortgage rate history: 1970s to 2026, national 30‑year fixed annual averages hit a record low around 3.15% in 2021. That lines up closely with Atlanta’s 2.96% for that year. The difference comes from timing differences in how annual and monthly averages get calculated, plus the mix of borrower lock‑ins across the metro. The national peak in late 2023 tracked Atlanta’s October high, proving that the forces driving rates operate at a macro level that hits all U.S. metros in roughly the same way. Federal Reserve policy, Treasury yield movements, inflation expectations… those things don’t pick favorites by zip code.
| Year | Atlanta 30‑Yr Avg | National 30‑Yr Avg | Spread |
|---|---|---|---|
| 2019 | 3.94% | 4.13% | –0.19% |
| 2021 | 2.96% | 3.15% | –0.19% |
| 2022 | 5.09% | 5.20% | –0.11% |
| 2023 | 6.71% | 7.00% | –0.29% |
| 2024 | 6.45% | 6.66% | –0.21% |
The small Atlanta discount visible in some years probably reflects competitive lender pricing. High‑growth metro, large purchase‑loan market, deep pool of creditworthy borrowers. When lenders compete for volume in a strong market, they shave a few basis points off quoted rates. Over a 30‑year loan, a 0.20% difference is noticeable but it’s not a game‑changer. It shifts monthly payments on a $350,000 mortgage by roughly $40 to $50.
Factors Driving Historical Mortgage Rates in Atlanta

Mortgage rates don’t move in a vacuum. They respond to a web of national monetary policy decisions, bond‑market dynamics, inflation pressures, and regional economic conditions that either amplify or soften the impact of those national forces.
National Monetary Policy and Treasury Yield Movements
The Federal Reserve sets short‑term interest rates and uses large‑scale asset purchases to influence longer‑term borrowing costs. From 2014 through 2018, gradual Fed rate hikes nudged Treasury yields upward, which lifted mortgage rates from the high‑3% range into mid‑4% territory. When the pandemic hit in March 2020, the Fed dropped its policy rate to near zero and started buying billions of dollars in mortgage‑backed securities. That flooded the market with demand and pushed 30‑year mortgage rates to record lows.
That support lasted through 2021. But as inflation surged past 8% in 2022, the Fed reversed course with the fastest tightening cycle in decades. Seven rate hikes in 2022 alone pushed the federal funds rate from near zero to over 5%. The 10‑year Treasury yield climbed from under 2% at the start of 2022 to over 4% by year‑end. Since mortgage rates track Treasury yields with a small spread to cover lender costs and risk, Atlanta’s 30‑year averages followed the bond market higher. They doubled from 2021 lows to above 5% by late 2022 and peaked near 8% in monthly readings during 2023.
Local Housing Dynamics (inventory, demand, migration)
Metro Atlanta’s rapid population growth and job expansion over the last decade meant housing demand stayed elevated even when rates climbed. In‑migration from higher‑cost metros kept the buyer pool deep. Inventory constraints during 2020 through 2023 limited the number of homes available to absorb that demand. When rates jumped in 2022, listing times extended and bidding wars cooled. But prices didn’t collapse the way they might have in a slower‑growth market.
Tight supply amplified the payment sensitivity buyers felt. A single percentage‑point increase in mortgage rates changes the monthly payment on a $350,000 loan by roughly $200 to $250. In a metro where inventory turns over quickly and buyers compete for the same handful of listings, that extra $200 a month can be the difference between winning a bid and getting priced out. Urban versus suburban splits mattered too. Higher‑priced suburbs and new‑construction projects often saw slightly different lender pricing and program availability, creating small pockets where rates or fees varied by a fraction of a point.
Economic Pressures (inflation, employment)
Inflation expectations drive bond yields, and bond yields drive mortgage rates. When inflation spiked in 2021 and 2022, investors demanded higher yields on long‑term bonds to compensate for eroding purchasing power. That pushed mortgage rates sharply higher. At the same time, Atlanta’s strong employment market kept household incomes growing, which supported demand even as borrowing costs rose. Unemployment in Metro Atlanta remained low throughout the decade, hovering near or below 4% for most of 2018 through early 2020, then recovering quickly after the pandemic shock.
Those employment tailwinds meant more buyers could qualify for loans and absorb higher monthly payments. But it also meant the Fed had less reason to ease policy quickly when inflation stayed elevated. The interplay between local job strength and national inflation created a cycle where Atlanta buyers faced high rates longer than they hoped, because the broader economy was running hot enough to justify continued Fed tightening.
How Atlanta’s Rate History Changed Buyer Costs and Affordability

Mortgage rates are the single biggest lever on monthly housing costs, and the decade’s swings reshaped what buyers could afford in Metro Atlanta. At the 2021 low of roughly 2.96% on a 30‑year fixed, a $350,000 loan carried a principal‑and‑interest payment around $1,475 per month. By the time rates peaked near 7.79% in October 2023, that same loan amount cost about $2,525 per month. That’s a $1,050 increase driven entirely by the rate change, before you add in property taxes, insurance, or HOA dues.
For buyers trying to stay within a fixed monthly budget, the size of the loan they could carry shrank dramatically. A household that could handle $2,000 a month in principal and interest could borrow roughly $475,000 at 3% but only about $285,000 at 7.5%. In a metro where median home prices climbed steadily over the decade, the rate surge in 2022 and 2023 locked many would‑be buyers out of neighborhoods they could have afforded just 18 months earlier.
Monthly Payment Examples at Different Rate Points (on $350,000 loan, 30‑year fixed):
- 2021 Low (around 2.65%): roughly $1,405 per month
- 2020 Average (around 3.11%): roughly $1,500 per month
- 2022 Spike (around 5.09%): roughly $1,910 per month
- 2023 Peak (around 7.79%): roughly $2,525 per month
- 2024 Mid‑Range (around 6.45%): roughly $2,215 per month
Refinancing activity surged during the 2020 and 2021 low‑rate window. Homeowners who locked in rates above 4% in the years before the pandemic rushed to refinance. They often cut monthly payments by hundreds of dollars or switched from 30‑year to 15‑year terms without increasing their payment. Lenders in Atlanta processed record volumes, and that wave of refinances freed up household cash that flowed into consumer spending and home improvements. When rates reversed in 2022, refinance applications fell sharply and stayed low through 2024. Only buyers who needed to move became the primary source of mortgage origination activity.
Historical Atlanta Mortgage Rate Extremes: Peaks, Lows, and Volatility Patterns

The decade’s most dramatic extremes bookend the whole story. The lowest monthly 30‑year fixed average Atlanta lenders posted came in February and March of 2021, hovering near 2.65%. That level sat so far below historical norms that it felt temporary even as borrowers rushed to lock it in. On the 15‑year side, monthly averages dipped to roughly 2.22% in early 2021. That made shorter‑term loans cheaper than many car loans.
At the opposite extreme, October 2023 delivered the decade’s highest monthly 30‑year average at about 7.79%. 15‑year rates peaked near 6.50% during the same window. That’s a nearly 300% increase in the spread between the low and high points. Affordability compressed, then expanded, then compressed again in ways that reshaped Metro Atlanta’s housing market twice in three years. The volatility profile looked similar to national patterns but hit harder locally because of tight inventory and strong buyer demand. When rates dropped, bidding wars intensified. When they spiked, listings lingered longer but prices didn’t fall proportionally.
| Extreme | Date | Rate |
|---|---|---|
| Lowest 30‑Year Monthly | Feb–Mar 2021 | ~2.65% |
| Highest 30‑Year Monthly | Oct 2023 | ~7.79% |
| Lowest 15‑Year Monthly | Early 2021 | ~2.22% |
| Highest 15‑Year Monthly | Oct 2023 | ~6.50% |
Between those peaks and troughs, rates moved in waves rather than straight lines. Small upticks in inflation data or Fed commentary could push weekly averages up or down by 0.25 to 0.50 percentage points. That created short windows where locking in early saved buyers money or cost them the chance at a better rate a week later. Seasonality played a quieter role. Rates tended to drift slightly higher in spring and summer when purchase activity peaked, then soften in late fall and winter. But the macro policy swings overwhelmed those smaller patterns during 2020 through 2023.
Data Sources and Methodology for Atlanta Mortgage Rate History

Building a reliable picture of Atlanta’s mortgage rate history over the last decade requires stitching together multiple data sources, each with its own scope and limitations. The foundation comes from Freddie Mac’s Primary Mortgage Market Survey, which tracks national average rates for conforming loans and provides a baseline that Metro Atlanta lenders track closely. For Treasury yield comparisons and broader economic context, the Federal Reserve Economic Data (FRED) platform offers historical series on 10‑year Treasury yields. Those move in parallel with mortgage rates and help explain the macro forces behind rate changes.
Lender surveys and regional mortgage‑rate aggregators fill in metro‑specific detail. Atlanta‑area lenders and mortgage brokers report weekly rate sheets. When you compile those snapshots over time, they reveal how local pricing deviates from national averages by small fractions of a percentage point. One data gap worth noting: the Federal Housing Finance Agency stopped publishing certain regional mortgage‑rate series after 2018. That created a hole in official metro‑level tracking that analysts fill using lender surveys and loan‑level datasets from Fannie Mae and Freddie Mac. Those loan‑level records include interest rates, origination dates, and geographic identifiers, so researchers can calculate metro averages even when summary reports aren’t published.
Primary Data Source Types:
- National mortgage‑rate surveys (Freddie Mac, Bankrate) that establish baseline averages.
- Treasury yield series from FRED for bond‑market context and correlation analysis.
- Lender‑reported rate sheets and metro aggregator platforms that capture Atlanta‑specific pricing and monthly extremes.
Final Words
In the action, we traced annual 30‑ and 15‑year averages from 2014–2024, highlighted pandemic lows and the 2022–2023 spike, and showed Atlanta’s close tracking of national averages within a few tenths. We also covered what drove those moves—Fed policy, bond yields, and tight local inventory—and how payments shifted at key points.
Key takeaway: the peak‑to‑trough swings meaningfully changed buying power and sparked refinance waves in tight Atlanta markets.
Keeping the historical atlanta mortgage rates last 10 years in mind will help you plan your budget and next move with more confidence.
FAQ
Q: What was the average mortgage interest rate 10 years ago?
A: The average mortgage interest rate 10 years ago (2016) was roughly in the mid-3% range for a 30‑year fixed; Atlanta typically tracked the national average within about 0.10–0.20 percentage points.
Q: What is the 3 7 3 rule in mortgage?
A: The 3 7 3 rule in mortgage isn’t a standard, widely used lender rule; lenders instead rely on DTI (debt-to-income), credit score, and down payment requirements, so check specifics with your lender.
Q: Will mortgage rates go down to 5% in 2027?
A: Whether mortgage rates fall to 5% in 2027 is uncertain; it depends on inflation cooling, Federal Reserve policy and Treasury yields—if inflation eases and the Fed cuts, 5% becomes more plausible.
Q: What salary do you need for a $500000 mortgage?
A: The salary needed for a $500,000 mortgage depends on rate, term, down payment and debts; at ~6% for 30 years P&I ≈ $3,000/month, so expect gross annual income around $110,000–$135,000 depending on lender rules.