


Think a one-point change in mortgage rates won’t alter your Atlanta home search? Think again.
Metro Atlanta rates jumped from about 3.25% to near 7% in recent years, and that math changes your monthly payment and what you can afford.
This post explains, in plain Atlanta terms, how those rate moves cut purchasing power, shift buyers to different ZIP codes, and make some owners hold tight to low-rate loans, which shrinks inventory.
I’ll give quick examples and simple steps to protect buying power so you can still buy near work or good schools.
Understanding Atlanta Mortgage Rate Trends and Their Immediate Impact on Affordability

Metro Atlanta mortgage rates have had a wild ride over the past four years, completely rewriting what buyers can afford each time they shift. Back in 2021, rates sat near 3.25%. By 2023, they’d rocketed to around 7.0%. Then they eased just a bit into the 6.5% to 7.0% range by early 2025. That’s one of the steepest climbs in recent housing history. And every single percentage point directly shrinks how much home a buyer can afford on the same monthly budget.
The math is simple, but it hits hard. Take a $750,000 loan. At 3.5%, monthly principal and interest runs $3,368. At 6.0%, that same loan costs $4,497 per month. At 7.0%, the payment climbs to $4,990. Moving from 3.5% to 7.0% adds $1,622 to the monthly payment. That’s money that could cover property taxes, insurance, or just stay in savings. For Atlanta’s average sale price of $481,500, a buyer putting 20% down borrows $385,200. At 6.5%, monthly principal and interest equals roughly $2,432. Drop the rate to 4.5%, and the payment falls to about $1,954. That’s $478 saved every month.
Rate changes touch every part of buying a home. They decide how hard buyers can compete, how long properties sit, and whether sellers adjust prices or dig in. In North Metro Atlanta spots like Alpharetta and Milton, where inventory stays tight, small rate shifts can swing a decision from making an offer to waiting. Or from listing to holding. Buyers used to low rates suddenly face sticker shock. Not just from the home price, but from the financing cost piled on top.
What changes when rates move:
- Monthly payment jumps that cut the maximum purchase price a buyer can qualify for under debt limits
- Lost purchasing power as higher rates shrink the loan amount a fixed monthly budget can support
- Negotiation leverage shifts when fewer buyers can afford higher price points, slowing competition in premium segments
- Refinance decisions where current homeowners holding 3% to 4% rates avoid selling, which limits inventory turnover and supply
Atlanta Mortgage Rates Compared to Recent Historical Cycles

Atlanta’s mortgage rate history over the past decade shows a clear pattern. Rates slowly fell through the 2010s, collapsed to lows nobody expected during the pandemic, then reversed hard. The 2021 low near 3.25% was a once in a generation moment. Buyers who locked in those rates got monthly payments that seem almost impossible today. By 2023, rates had jumped to around 7.0%, cooling a market that had been sprinting. Through 2024 and into early 2025, rates dropped slightly to the 6.75% area. Some relief, but nowhere near the affordability highs of two years before.
Past cycles prove that when rates ease, competition usually comes roaring back and prices climb. The 2023 spike brought a sharp drop in buyer demand across Metro Atlanta, especially in higher price brackets. Demand partially recovered in 2024 as buyers adjusted and inventory stayed tight. But even with that bounce, activity remained well below the 2021 to 2022 frenzy. For affordability, the lesson is straightforward. Lower rates often trigger renewed competition that eats up some of the monthly payment savings by pushing purchase prices higher.
| Year | Approximate Average Rate | Demand Trend | Affordability Notes |
|---|---|---|---|
| 2021 | 3.25% | Very High | Record low rates, intense bidding, rapid price growth |
| 2022 | 5.0%–6.0% | Declining | Rising rates began cooling competition mid-year |
| 2023 | ~7.0% | Sharp Drop | Highest rates in decades, demand fell, longer listing times |
| 2024 | 6.5%–7.0% | Partial Rebound | Buyers adjusted budgets, inventory still tight, prices stable |
| Early 2025 | 6.5%–6.75% | Moderate | Slight rate relief, cautious buyers, slower upper-bracket sales |
How Atlanta Monthly Mortgage Payments Shift with Different Interest Rates
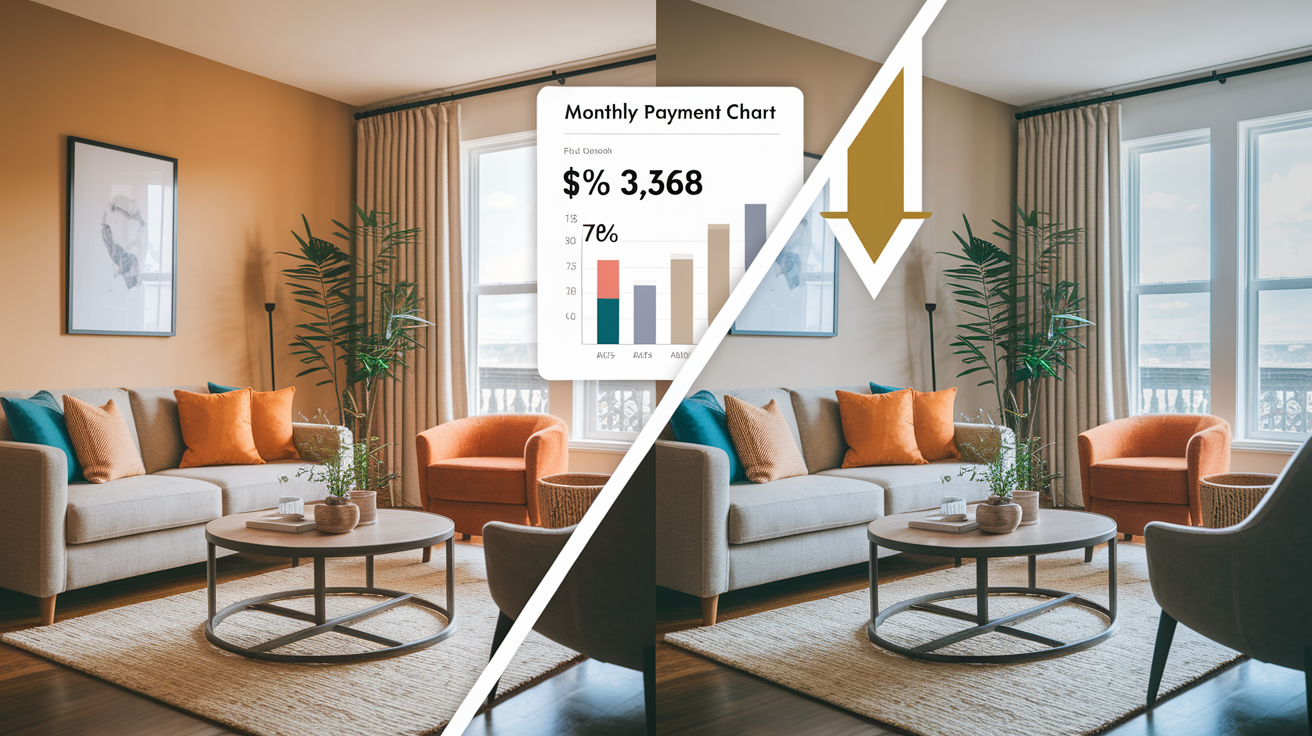
Monthly mortgage payments track with interest rates. The differences pile up fast. Take Atlanta’s average sale price of $481,500. After a 20% down payment, the loan amount is $385,200. At 6.5%, the monthly principal and interest payment lands around $2,432. Drop the rate to 5.5%, and the payment falls to roughly $2,187. At 4.5%, it slides down to about $1,954. Moving from 6.5% to 4.5% saves around $478 per month. That’s roughly $5,736 per year. Enough to cover property taxes, part of homeowners insurance, or HOA fees in many North Metro communities.
For buyers stretching to larger loans, the impact gets bigger. On a $750,000 loan, the payment at 3.5% is $3,368. At 6.0%, it jumps to $4,497. At 7.0%, it climbs to $4,990. That $1,622 monthly difference between 3.5% and 7.0% equals nearly $19,500 per year. That’s a sum that can decide whether a household qualifies for the loan at all. Lenders typically cap total monthly debt, including the mortgage, car loans, credit cards, and other obligations, at about 43% to 50% of gross monthly income. That’s called the debt to income ratio or DTI. Higher interest rates push monthly mortgage payments higher, leaving less room under the DTI cap. Buyers either lower their purchase price or bring in more income.
Amortization schedules make this even more sensitive because early payments on a 30 year loan are mostly interest. At higher rates, a bigger chunk of each monthly payment goes to the lender instead of building equity. Over the first few years, buyers at 7.0% see slower principal paydown compared to buyers at 4.5%, even though both are making on time payments. That difference matters for home equity growth and for future refinancing or selling decisions.
| Interest Rate | Loan Amount | Monthly P&I Payment | Monthly Difference vs. 3.5% |
|---|---|---|---|
| 3.5% | $750,000 | $3,368 | — |
| 6.0% | $750,000 | $4,497 | +$1,129 |
| 7.0% | $750,000 | $4,990 | +$1,622 |
| 6.5% | $385,200 | $2,432 | — |
Purchasing Power Changes for Atlanta Buyers as Mortgage Rates Rise or Fall
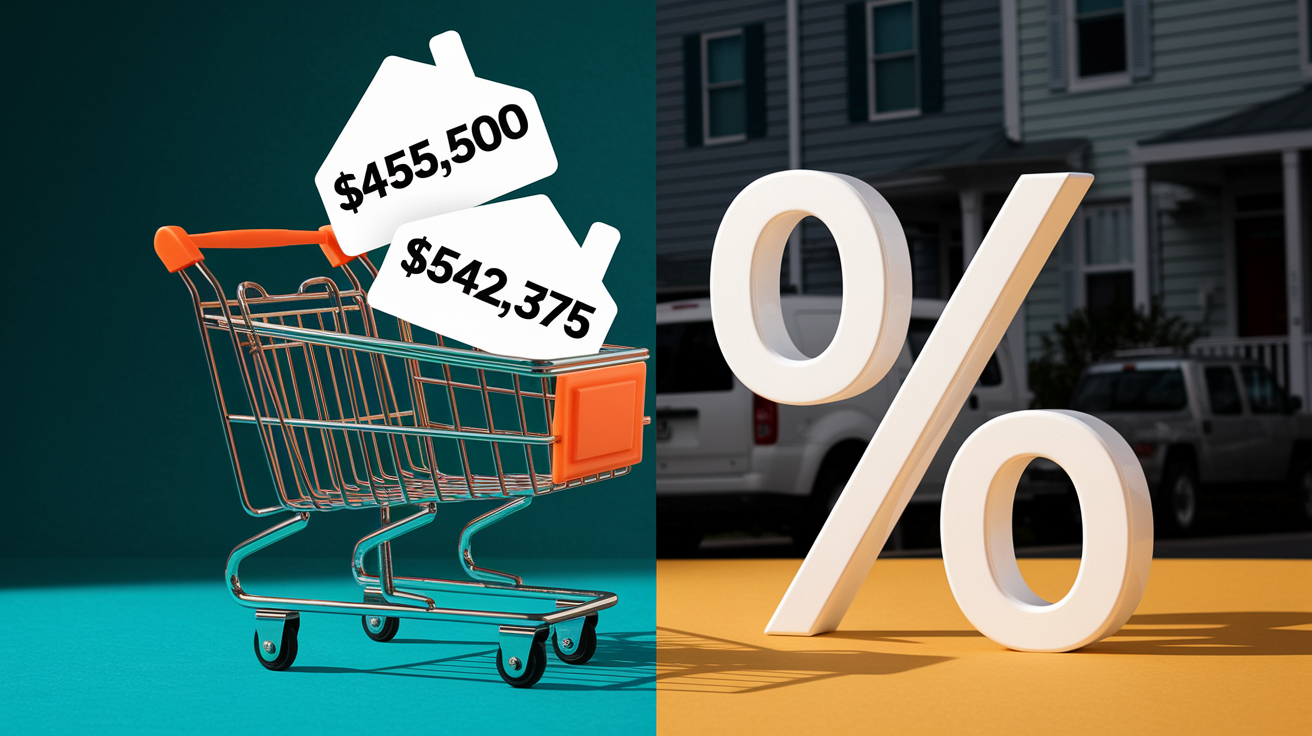
Purchasing power shifts hard when rates move, even by a single percentage point. If a buyer has a fixed monthly budget of $2,200 for principal and interest, that budget supports a loan of around $348,400 at 6.5%. Add back a 20% down payment, and the maximum purchase price lands near $435,500. Now drop the rate to 4.5%. That same $2,200 monthly budget suddenly supports a loan of roughly $433,900, pushing the maximum purchase price up to about $542,375. The difference, around $106,875 in purchase price capacity, shows how rate drops materially expand what buyers can afford without changing their income or down payment.
The reverse happens when rates climb. Buyers who qualified for a $500,000 home at 4.5% find themselves priced out or forced to settle for a $425,000 home at 6.5%. Everything else equal. In competitive Atlanta submarkets where inventory is already tight, that downward adjustment can mean leaving preferred school zones, adding commute time, or accepting an older home that needs work. The lost purchasing power doesn’t just change the price range. It reshapes the entire search.
What happens to affordability for Atlanta buyers:
- Budget compression. Every 1% rate increase typically cuts loan capacity by roughly 10% to 12%, forcing buyers to reset price expectations or bump up down payments to bridge the gap.
- Neighborhood trade offs. Buyers priced out of Alpharetta or Milton shift searches to adjacent areas with lower price points, changing school access, commute patterns, and property types.
- Longer closing timelines. Higher rates often come with tighter underwriting and slower buyer commitment, stretching the time from contract to close and increasing holding costs for sellers.
Atlanta Housing Inventory Constraints That Amplify Rate-Driven Affordability Shifts
Metro Atlanta’s inventory challenges make every rate movement hit harder. Many homeowners locked in mortgage rates between 3% and 4% during 2020 and 2021. When rates surged in 2023, those owners had almost no reason to sell and trade up. Doing so meant giving up their low rate loan and taking on a new mortgage at 7%. That slowed turnover across the region, keeping inventory below historical norms even as buyer demand cooled.
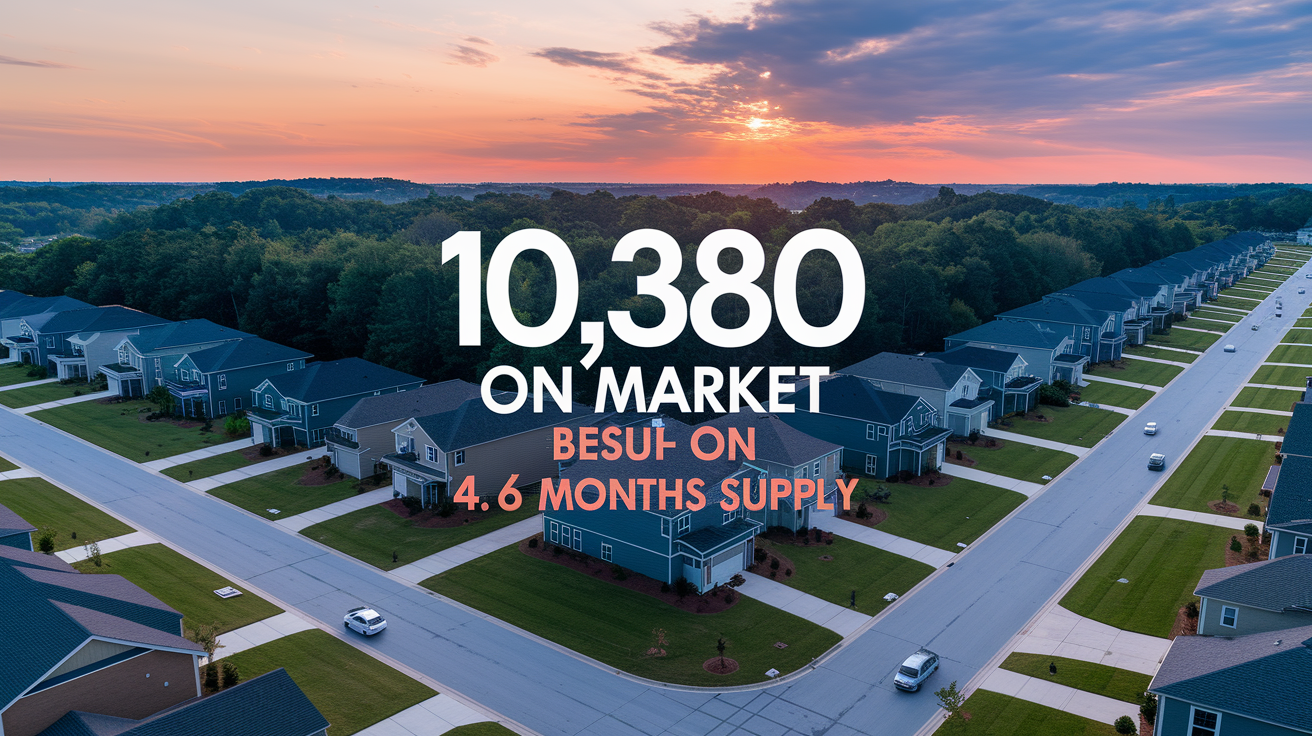
In January 2025, Metro Atlanta reported 10,380 homes on the market, up 61% from the prior month but still not enough to balance demand fully. New listings jumped 7% year over year, yet months of supply hovered around 4.6 months. Just shy of the balanced market benchmark of five to six months. In submarkets like Alpharetta, Milton, and parts of North Fulton, active listings stayed especially tight. Particularly for move in ready homes in top school districts. When inventory is constrained, even small rate declines can trigger renewed competition. The limited supply means multiple buyers chase the same properties.
The inventory rate feedback loop works both ways. When rates rise, some buyers pause, reducing competition and giving sellers longer listing times. But because fewer owners are willing to sell and lose their low rates, inventory doesn’t expand much. Prices stay relatively stable. When rates fall, demand rebounds faster than new supply can enter the market, pushing prices upward and reducing affordability gains from the lower financing cost. For Atlanta buyers, timing matters. But so does realistic pricing and readiness to move fast when the right property shows up.
Atlanta Buyer Behavior as Mortgage Rates Change

Higher mortgage rates in 2023 through early 2025 fundamentally changed how buyers approached the Metro Atlanta market. Demand dropped sharply in 2023, with many buyers delaying purchases in hopes that rates would fall. Those who stayed active adjusted their expectations. Targeting smaller homes, exploring neighborhoods farther from job centers, or shifting from newer construction to older inventory to stay within budget. Longer search times became common, especially in upper price brackets where higher rates pushed monthly payments beyond comfortable debt to income ratios.
Negotiation power shifted too. In a lower rate environment, multiple offers and bidding wars were standard. By 2024, well priced homes still attracted steady interest, but buyers became slower to commit and more willing to ask for repairs, closing cost assistance, or price reductions. Sellers who priced aggressively often faced extended days on market and eventual price cuts. Buyers gained breathing room to conduct thorough inspections, compare financing options, and negotiate terms without the pressure of competing bids.
Preferences evolved. Move in ready homes with recent upgrades, energy efficient appliances, and low maintenance finishes became more attractive. Buyers wanted to avoid immediate renovation costs on top of higher monthly payments. New construction kept appeal in some submarkets, offering warranties and modern layouts, though builders adjusted pricing and incentives to match the slower pace. The overall buyer mindset shifted from urgency to caution. Households prioritized affordability and long term value over speed and status.
How Buyers Adjust Budgets and Expectations
As rates climbed, buyers recalibrated budgets in real time. Some increased down payments to lower loan amounts and monthly costs. Others explored different financing, including adjustable rate mortgages or first time buyer programs with lower initial rates. Many simply accepted smaller homes or different locations, trading a shorter commute or preferred school district for a payment they could manage. The constant throughout was a careful reassessment of what “affordable” meant under the new rate environment. An exercise that often required multiple pre approval updates and honest conversations with lenders about trade offs between purchase price, monthly payment, and long term flexibility.
Mortgage Product Choices That Affect Affordability in Atlanta

Loan type selection plays a big role in affordability. Higher rates have pushed more Atlanta buyers to explore beyond the traditional 30 year fixed mortgage. A 30 year fixed remains the most common choice, offering predictable payments and long term rate stability. But with rates in the 6.5% to 7.0% range, the monthly cost can stretch budgets thin. Some buyers turn to 15 year fixed loans, which carry lower interest rates, often 0.5% to 0.75% below 30 year rates, but require higher monthly payments because the loan pays off faster. That works for households with strong income and minimal other debt.
Adjustable rate mortgages, or ARMs, provide another path. They offer lower introductory rates for a fixed period, commonly five, seven, or ten years, before adjusting based on market conditions. An ARM can reduce monthly payments in the early years, preserving cash flow and easing qualification. The risk is that rates can rise after the initial period, increasing payments down the line. For buyers planning to sell or refinance within a few years, an ARM can make sense. For those expecting to stay long term, the uncertainty might outweigh the short term savings.
Government backed loans, FHA, VA, and USDA, expand affordability for qualifying buyers. FHA loans allow down payments as low as 3.5% and accept lower credit scores, making homeownership accessible to first time buyers or those with limited savings. VA loans, available to eligible veterans and active duty service members, offer zero down payment and competitive rates without requiring private mortgage insurance, or PMI. USDA loans target rural and suburban areas, including parts of Metro Atlanta’s outer counties, with zero down payment options for moderate income households. Each program carries specific requirements and trade offs, but all can materially improve affordability compared to conventional loans requiring 10% to 20% down.
Typical borrower fit by product:
- 30 year fixed. Best for buyers prioritizing payment stability and long term ownership, even if rates are higher today. Most common for families planning to stay five plus years.
- 15 year fixed. Suited to buyers with higher income and minimal debt who want to build equity faster and pay less total interest, despite higher monthly payments.
- ARM. Works for buyers planning to sell or refinance within the initial fixed period, or those expecting income growth that can absorb future rate adjustments.
- FHA. Good for first time buyers with smaller down payments or credit scores in the mid 600s, accepting slightly higher monthly costs, including mortgage insurance, in exchange for easier qualification.
Rate Locks, Timing Strategies, and Forecasts for Atlanta Mortgage Rates

Timing a home purchase around mortgage rate movements requires balancing two competing risks. Paying higher rates now versus waiting and facing higher home prices later. In early 2025, rates sat near 6.5% to 7.0%, down slightly from 2023 highs but still well above pandemic lows. Many buyers hesitated, hoping for further declines later in the year. The challenge is that if rates do fall, pent up demand will likely flood the market, increasing competition and pushing home prices higher. The monthly payment savings from a 1% rate drop can be partially or fully offset by a 5% to 10% increase in purchase price.
Pre approval windows typically last 60 to 90 days. That means buyers have about two to three months of locked in purchasing power before income, asset, and credit documentation must be refreshed. Some lenders offer extended programs, such as a 120 day Upfront Approval Guarantee, that hold approval and funding commitment for four months, giving buyers more flexibility to shop without rushing. Rate locks, by contrast, secure a specific interest rate for a set period, usually 30 to 60 days. Locking too early can mean missing a rate drop. Locking too late risks a rate increase before closing. The decision depends on rate outlook, contract timelines, and personal risk tolerance.
For Atlanta buyers watching rate trends, the key indicators include national mortgage rate movement, tied to 10 year Treasury yields and inflation expectations, local inventory levels, and buyer demand indices. If rates decline in late 2025 or into 2026, expect renewed market activity and price pressure. If rates stay elevated, the market will likely continue the 2024 pattern. Stable prices, selective buyers, and longer listing times in higher price ranges. Either way, preparation helps. Gathering documents, securing pre approval, and understanding monthly payment scenarios across a range of rates provides a head start when the right opportunity appears.
Five step timing strategy for Atlanta buyers:
- Get pre approved early with full income, asset, credit, and debt documentation, even if you’re not ready to make an offer, so you understand exactly what you can afford at current rates.
- Monitor rate trends and local inventory weekly, tracking whether new listings are rising or falling and whether rates are moving up or down. This gives you context for negotiating leverage.
- Decide whether to lock or float your rate based on contract timelines and rate outlook. If rates are rising or stable, lock early. If falling, consider a float down option or delayed lock.
- Shopping for the best Atlanta mortgage rate by comparing quotes from at least three lenders on the same day, ensuring you’re getting competitive terms and understanding fee differences beyond the rate itself.
- Plan for potential refinancing if you buy at a higher rate, knowing that closing costs and break even timelines will determine whether refinancing makes sense if rates drop later.
Refinancing Opportunities and Affordability Scenarios for Atlanta Homeowners

Refinancing offers existing homeowners a path to lower monthly payments if rates decline after their original purchase. Buyers who closed at 6.5% to 7.0% in 2024 or early 2025 might find refinancing worthwhile if rates drop to 5.5% or lower later in the year or into 2026. The savings can be substantial. On a $385,200 loan, moving from 6.5% to 5.5% reduces the monthly principal and interest payment from roughly $2,432 to about $2,187. That’s $245 monthly savings. Over a year, that’s nearly $3,000. Over the remaining loan term, tens of thousands in interest savings.
The catch is the break even calculation. Refinancing typically costs 2% to 5% of the loan amount in closing fees. Appraisal, title, lender charges, and other administrative costs. On a $385,000 loan, that’s $7,700 to $19,250. Divide those costs by the monthly savings to find the break even point. At $245 per month saved, a $7,700 refinance cost breaks even in about 31 months. If you plan to stay in the home longer than that, refinancing makes sense. If you might sell sooner, the upfront cost might not be worth it. Some lenders offer no closing cost refinances, rolling fees into the loan balance or charging a slightly higher rate in exchange for waiving upfront costs. That option can work if you want to preserve cash but still lock in a lower rate.
Homeowners who secured 3% to 4% rates in 2020 and 2021 faced a different decision in 2024 and early 2025. With rates elevated above 6%, refinancing would have increased their monthly payments and total interest costs. Most avoided it entirely. That decision contributed to low inventory turnover across Metro Atlanta. Moving would have meant giving up an ultra low rate mortgage. For these owners, refinancing only makes sense if they need cash out for renovations, debt consolidation, or other expenses. Even then, the trade off must be carefully weighed.
| Scenario | Rate Drop | Monthly Payment Change | Estimated Break-Even (Months) |
|---|---|---|---|
| 6.5% → 5.5% | 1.0% | ~$245 savings | 31 months at $7,700 cost |
| 7.0% → 5.5% | 1.5% | ~$490 savings | 16 months at $7,700 cost |
| 6.5% → 6.0% | 0.5% | ~$125 savings | 62 months at $7,700 cost |
Final Words
Rates moving from the low 3s to near 7% really changed monthly payments and the homes you can afford right now. That shift cut purchasing power, made some buyers downsize or change neighborhoods, and put more pressure on limited Atlanta inventory.
Loan choice, timing, and a smart rate-lock can all soften the hit. If you want clarity, run the numbers with a lender and compare quotes — understanding how atlanta mortgage rate trends impact home affordability gives you a clear next step and confidence.
FAQ
Q: How do interest rates impact home affordability?
A: Interest rates impact home affordability by changing your monthly payment; each 1% rise often adds hundreds of dollars. In Atlanta, a 4.5%→6.5% shift can increase P&I by roughly $400–$500 monthly on typical loans.
Q: Are home prices dropping in Atlanta?
A: Home prices in Atlanta aren’t broadly dropping; they eased after 2021 peaks then mostly stabilized through 2024–25. Local results vary—low inventory in many submarkets often keeps prices firm despite rate swings.
Q: Is $100,000 a good salary in Atlanta?
A: A $100,000 salary in Atlanta is generally solid but depends on family size, debts, down payment, and where you buy (Intown vs OTP). Commute, schools, and HOA fees change what you can comfortably afford.
Q: What is the cheapest month to buy a house?
A: The cheapest month to buy is usually late fall to winter (November–January) when buyer traffic slows. In Atlanta this can mean less competition and more motivated sellers, though inventory may be smaller.