

Think Midtown gives the best cash returns in Atlanta? Think again.
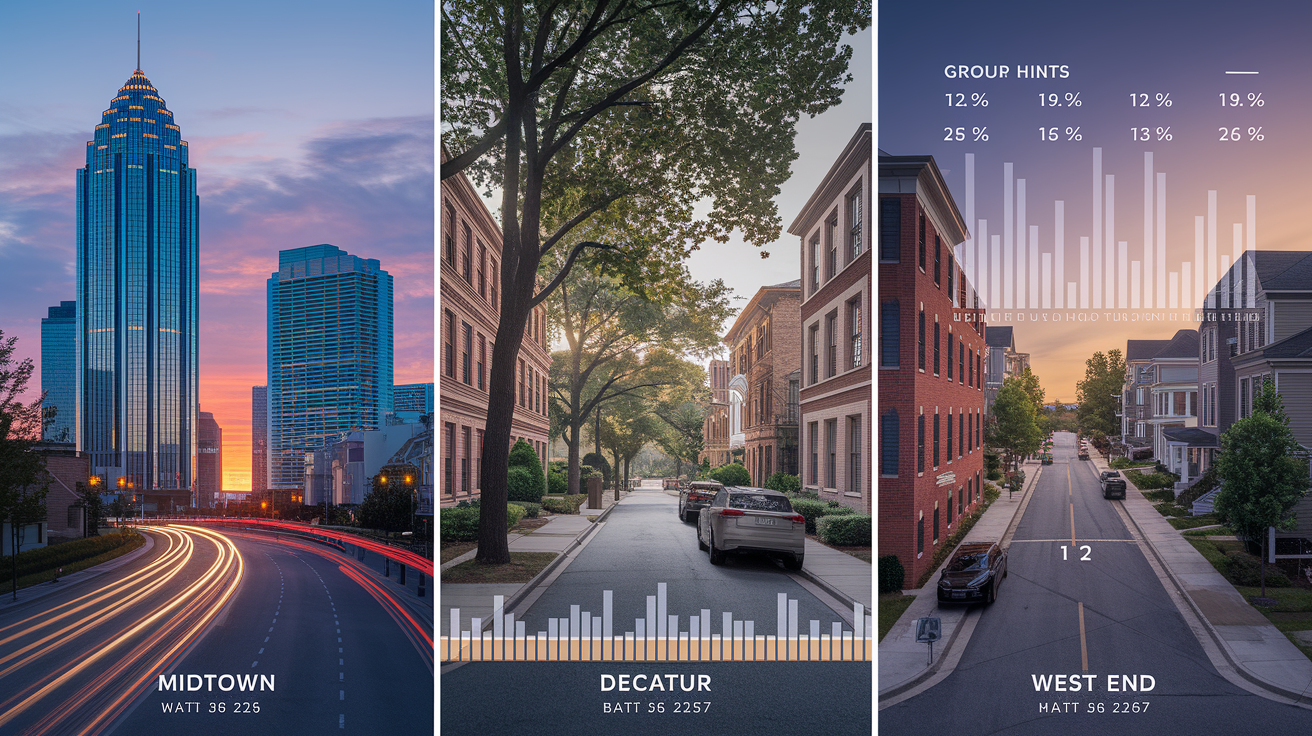
When you compare rental yield (annual rent divided by purchase price) across Midtown, Decatur, and West End, the story flips.
West End often posts the highest immediate cash yield, Decatur balances steady rents and very low vacancy thanks to school zones, and Midtown trades higher prices for appreciation and stable professional/student demand near Georgia Tech and the BeltLine.
This post breaks down gross yield, cap rate, vacancy risk, and who each neighborhood actually fits.
Are you chasing monthly cash or patient appreciation?
Rental Yield Breakdown Across Midtown, Decatur, and West End
Rental yield comes down to what you pay versus what the property earns. Gross rental yield is just annual rent divided by purchase price, then multiplied by 100. Net operating income strips out mortgage interest but keeps everything else: property taxes, insurance, HOA dues, maintenance, management fees. Cap rate? That’s NOI divided by purchase price, times 100. Clean snapshot of how the property performs before you factor in financing. Cash on cash measures pre-tax cash flow against the total cash you actually put down, so it shows you what leverage and monthly reality look like. In 2023 and 2024, these numbers tell very different stories across Midtown, Decatur, and West End.
Midtown gives you moderate gross yields but you’re paying more upfront than anywhere else. Median purchase prices sit around $425,000 to $465,000 for investor-grade condos or small townhomes. Monthly rents? Between $2,200 and $2,800, depending on unit size and how old the building is. You’re looking at gross rental yields between 5.7% and 6.4%, with cap rates landing in the 4.5% to 5.2% range after operating costs. Vacancy risk stays low because of employment density, student turnover every August, and you’re right next to Georgia Tech and the Midtown business district. Decatur’s acquisition profile looks similar: median prices run $390,000 to $440,000 for single-family homes or newer townhomes. But monthly rents push higher, between $2,400 and $2,900, and that bumps gross yields into the 6.8% to 7.5% zone. Cap rates in Decatur run 5.4% to 6.1%. Vacancy exposure is even lower because of the school-zone draw and family renters who sign longer leases. West End pricing drops to $210,000 to $280,000 for renovated older stock. Monthly rents between $1,650 and $2,150 deliver gross yields of 8.0% to 9.2%, with cap rates in the 6.8% to 7.5% band. Vacancy risk is a bit higher, tied to gentrification shifts and neighborhood reputation, but BeltLine proximity and redevelopment momentum are tightening that gap every year.
| Neighborhood | Avg 2023–2024 Purchase Price | Avg Monthly Rent | Gross Rental Yield | Typical Cap Rate | Vacancy Risk Level |
|---|---|---|---|---|---|
| Midtown | $445,000 | $2,500 | 6.0–6.4% | 4.5–5.2% | Low |
| Decatur | $415,000 | $2,650 | 6.8–7.5% | 5.4–6.1% | Very Low |
| West End | $245,000 | $1,900 | 8.0–9.2% | 6.8–7.5% | Moderate |
Cash flow focused investors usually go with West End. The percentage return on cash invested is highest, even after you factor in moderately higher turnover and maintenance reserves for older housing stock. Appreciation focused investors lean toward Midtown for job-driven rent escalation and stable demand, accepting a lower initial yield in exchange for capital gain upside. Decatur fits hybrid investors who want moderate cash flow paired with low vacancy risk and steady value growth reinforced by school district reputation. If you care most about month-to-month cash with manageable upfront cost, West End wins. If you want predictable, lower-stress operations and patient wealth building, Decatur balances yield and stability. Midtown makes sense when you value liquidity, dense rental demand, and a professional tenant base more than immediate cash flow.
Demand, Economic Anchors, and Redevelopment Forces Behind Neighborhood Yield Differences

Midtown rental premiums start with employment density and walkability. Georgia Tech draws several thousand students who rent year-round or during academic terms. The broader Midtown district, centered on Peachtree Street and West Peachtree Street, holds corporate offices, healthcare campuses, creative agencies, and hospitality employers. Young professionals working downtown or in adjacent office parks choose Midtown to cut commute time. The neighborhood’s MARTA rail stops at Midtown and North Avenue stations make car-free living practical. That combination of student turnover and professional demand keeps occupancy stable and supports premium rents, even as purchase prices climb. Walkability to Piedmont Park, restaurants on 10th Street and along the BeltLine Eastside Trail, and proximity to major highways add convenience that tenants will pay extra for every month.
Decatur’s demand drivers center on school zones and civic investment. Decatur City Schools consistently rank among the strongest in Metro Atlanta, pulling families who care about public education quality and want a small-town downtown within a metro-area context. The City of Decatur has invested in parks, sidewalk networks, mixed-use development around the downtown square, and MARTA rail access at Decatur station. That package appeals to professionals with children and empty-nesters who value walkability and local arts programming. Rental demand in Decatur skews toward families signing 12-month or longer leases, which lowers turnover costs and reduces vacancy between tenants. The family-oriented tenant base also tends to maintain properties carefully, reducing wear and capital replacement frequency.
West End demand reflects ongoing redevelopment tied to BeltLine expansion and shifting demographics. The neighborhood sits along the BeltLine Westside Trail corridor, with segments opening in phases and catalyzing retail, mixed-use, and residential development. Historically affordable and majority African American, West End is experiencing demographic turnover as younger professionals move in seeking lower purchase prices near BeltLine access. That transition brings both opportunity and friction around affordability preservation, but for investors the practical effect is rising rents and tightening occupancy as the neighborhood becomes more recognized citywide. Proximity to downtown, MARTA’s West End station, and highway access via I-20 support tenant demand from renters working downtown, at the airport, or in southwest employment corridors.
Major demand forces shaping rents and growth expectations:
Midtown: Employment hubs (Georgia Tech, Midtown business district), transit access (MARTA rail, BeltLine), and walkable amenities drive professional and student tenant demand.
Decatur: School zone reputation, civic infrastructure investment, downtown retail and dining, and family-oriented rental base create stable long-term demand.
West End: BeltLine redevelopment spillover, affordability relative to intown neighborhoods, and demographic shifts increase recognition and rent growth potential.
Shared citywide factor: Atlanta’s relatively low property taxes and moderate operating costs compared to other major metros let investors retain more net operating income across all three neighborhoods.
Occupancy, Vacancy, and Tenant Demand Patterns in Midtown, Decatur, and West End

Midtown tenant demand concentrates among young professionals in their late twenties to mid thirties and students at Georgia Tech or nearby institutions. Lease terms usually run 12 months, with heavier turnover in July and August when students graduate or relocate and corporate relocations cluster. That seasonal pattern means vacancy risk spikes if you list a unit in late spring or early summer, but overall occupancy stays high because the next wave of tenants starts searching by June. Professional tenants in Midtown often want building amenities (gym, parking, rooftop space) and walkability to work or MARTA, so well-maintained condos or townhomes lease quickly. Student renters may accept older interiors if the price point and location fit, but expect more frequent maintenance calls and occasional turnover mid-lease if academic plans shift.
Decatur attracts families with school-age children and empty-nesters who want a suburban feel with urban access. Family renters typically sign longer leases and renew more often because moving disrupts school enrollment and neighborhood ties. Vacancy risk in Decatur is among the lowest in Metro Atlanta. Units that hit the market during the school year often lease within two to three weeks if priced at or slightly below comparable listings. Tenant quality tends to be high, with lower rates of late payments or property damage. Families maintain yards and common areas to preserve the neighborhood character they moved in for. The downside is slower rent escalation, since family budgets are more sensitive to year-over-year increases and you risk losing a stable tenant if you push too hard. Decatur offers predictable cash flow with minimal vacancy gaps.
West End shows moderately higher vacancy exposure tied to ongoing neighborhood transition. Tenant demographics mix long-time residents, young professionals attracted by affordability and BeltLine access, and short-term renters testing the neighborhood before committing. Turnover can be higher than Midtown or Decatur, especially in blocks farther from the BeltLine trail or MARTA station, where neighborhood perception lags redevelopment momentum. Occupancy is tightening as more retail and mixed-use projects open along the BeltLine corridor, and rents are climbing faster than in more established neighborhoods. If you buy in West End, budget for one to two months of vacancy per tenant cycle and plan proactive marketing (professional photos, competitive pricing, and quick response times) to minimize gaps.
Five occupancy risk factors to evaluate across Midtown, Decatur, and West End:
Seasonal turnover patterns: Midtown peaks in summer; Decatur stays stable year-round; West End shows less predictable seasonality tied to redevelopment pace.
Tenant demographic stability: Decatur families renew most often; Midtown professionals and students turn over annually; West End mixes long-term and transient renters.
Neighborhood reputation and safety perception: Midtown and Decatur benefit from established positive reputations; West End perception is improving but still varies block by block.
Proximity to anchors: Units within a 10-minute walk of MARTA, BeltLine access, or major employers lease faster and command higher rents in all three neighborhoods.
Property condition and amenities: Updated interiors, parking, and in-unit laundry reduce vacancy risk; older or poorly maintained units sit longer, especially in West End where tenant options are growing.
For 2024, expect Decatur to maintain the lowest average vacancy rate, typically under 5% annually if the property is well located and fairly priced. Midtown will hold steady around 6% to 8% vacancy, with spikes during summer turnover seasons. West End may run 8% to 12% vacancy depending on block-level redevelopment progress and how aggressively you market, but that higher exposure is the tradeoff for stronger cash on cash returns when units are occupied.
Long-Term Appreciation and Development Forces Impacting Rental Yield

Midtown appreciation is driven by employment density and limited new land supply. The district is effectively built out, so new construction focuses on infill redevelopment, replacing older low-rise buildings with high-rise condos and mixed-use towers. That supply constraint, paired with steady job growth in technology, healthcare, and professional services, pushes property values upward year over year. Between 2018 and 2024, Midtown condo and townhome values appreciated at an average annual rate near 5% to 6%, outpacing Metro Atlanta’s overall median home value growth. For investors, that means your initial moderate cap rate is offset by capital gain accumulation, and rents climb in tandem with property values as the professional tenant base tolerates gradual increases. Midtown is a long-term wealth building play more than a cash flow maximizing one. Liquidity stays strong because buyer demand (both owner-occupant and investor) remains consistent.
Decatur’s appreciation reflects school zone reinforcement and targeted civic investment. The city has maintained its school reputation while adding parks, streetscape improvements, and mixed-use development around the downtown square and along transit corridors. Home values in Decatur appreciated at rates similar to or slightly above Midtown, roughly 5% to 6.5% annually between 2018 and 2024. Demand remains strong even during broader market slowdowns because families put school access over timing the market. Redevelopment projects like the expansion of retail and residential along Church Street and ongoing BeltLine connectivity plans add incremental value. The city’s zoning policies encourage mixed-income housing, which stabilizes neighborhood diversity while supporting property values. For rental investors, Decatur offers appreciation that compounds steadily without the volatility seen in more speculative neighborhoods, and the low vacancy risk means you collect rent consistently while values climb.
West End appreciation is accelerating due to BeltLine-driven gentrification and infrastructure investment. Property values in West End climbed at an average annual rate near 8% to 10% between 2020 and 2024, faster than Midtown or Decatur, as the neighborhood transitions from historically undervalued to an emerging intown destination. The BeltLine Westside Trail segment, retail development along Lee Street and Ralph David Abernathy Boulevard, and new mixed-use projects are reshaping the streetscape and attracting both residents and investors. That momentum creates appreciation upside but also introduces volatility. If redevelopment stalls or affordability displacement generates regulatory pushback, value growth could slow. For investors willing to accept moderate near-term vacancy risk, West End offers the strongest potential for capital gains over a five to seven year hold. Rental yield improves as neighborhood perception tightens and rents catch up to property value increases.
Expense Factors That Influence Net Rental Yield in Each Neighborhood

Operating expenses vary by property type and neighborhood age, and those differences directly affect your net yield after deducting costs. Midtown properties, especially condos in newer high-rises, carry HOA fees that typically range from $350 to $600 per month, covering building insurance, common-area maintenance, amenities like gyms or rooftop decks, and sometimes utilities. Those fees reduce your net operating income but also lower your direct maintenance burden, since the HOA handles exterior repairs and capital replacements. Property management costs in Midtown run 8% to 10% of monthly rent for full-service management. You should budget an additional 1% to 1.5% of property value annually for reserve capital expenses like HVAC replacement or appliance upgrades. Property taxes in Fulton County average around 1.1% to 1.3% of assessed value, and insurance for a condo typically runs $800 to $1,200 per year.
Decatur single-family homes and townhomes generally carry lower or no HOA fees, but you absorb all maintenance and exterior repair costs yourself. Property management fees in Decatur are similar to Midtown (8% to 10% of rent), and you should reserve 1.5% to 2% of property value annually for maintenance and capital replacements, since you own the roof, HVAC, foundation, and landscaping outright. Property taxes in Decatur are levied by both DeKalb County and the City of Decatur. The combined effective rate runs around 1.4% to 1.6% of assessed value, slightly higher than Fulton County but still moderate by national standards. Insurance for a single-family rental in Decatur typically costs $1,200 to $1,800 per year, depending on coverage limits and deductible.
| Neighborhood | Avg HOA/Operating Burden | Maintenance Trend | Typical Management Cost % |
|---|---|---|---|
| Midtown | $350–$600/month HOA | Lower direct burden; HOA handles building systems | 8–10% |
| Decatur | $0–$150/month HOA | Higher owner responsibility for roof, exterior, yard | 8–10% |
| West End | $0–$100/month HOA | Older homes require higher capital reserves | 8–10% |
West End properties (mostly older single-family homes and renovated bungalows) carry minimal or no HOA fees, but maintenance reserves need to be higher because housing stock dates to the early-to-mid 20th century. Budget 2% to 2.5% of property value annually for maintenance and capital expenses. Expect occasional surprises like plumbing, electrical, or foundation repairs that were deferred by prior owners. Property management costs remain consistent at 8% to 10%, and property taxes in Fulton County run 1.1% to 1.3% of assessed value. Insurance may run slightly higher than Midtown condos ($1,000 to $1,500 per year) due to the age and condition of the housing stock and perceived neighborhood risk factors.
After subtracting these operating expenses, Midtown’s net yield typically lands 1.5 to 2 percentage points below its gross yield due to HOA fees and higher purchase prices. Decatur’s net yield drops about 1.2 to 1.8 points below gross, balanced by lower HOA costs but higher direct maintenance responsibility. West End’s net yield falls 1.8 to 2.2 points below gross, driven by older-home maintenance reserves and moderately higher vacancy-related costs. In all three neighborhoods, professional property management is worth the 8% to 10% fee because it reduces turnover friction, ensures timely maintenance, and handles tenant screening, which protects your cash flow and limits legal exposure.
ROI and Cash on Cash Return Modeling for Atlanta Neighborhood Investments

Understanding your return starts with calculating the metrics that separate gross revenue from actual profit. The formulas you need are gross rental yield, net operating income, cap rate, and cash on cash return. Running all four gives you a complete picture of property performance before and after financing.
Core Formulas and Definitions
Gross rental yield equals annual gross rent divided by purchase price, multiplied by 100. Example: if you buy a Decatur townhome for $415,000 and collect $2,650 per month ($31,800 per year), gross yield is 7.7%. Net operating income (NOI) takes annual gross rent, subtracts all operating expenses except mortgage interest, and gives you the cash the property generates before debt service. Example: $31,800 rent minus $6,200 in taxes, insurance, management, HOA, and maintenance leaves NOI of $25,600. Cap rate divides NOI by purchase price and multiplies by 100, so $25,600 divided by $415,000 equals 6.2%. Cash on cash return divides annual pre-tax cash flow (NOI minus all debt service) by total cash invested (down payment, closing costs, upfront repairs), then multiplies by 100. Example: if you put $100,000 down and finance the rest at 7%, annual debt service is roughly $24,500, leaving pre-tax cash flow of $1,100, so your CoC return is 1.1%. If you pay all cash, your CoC equals your cap rate.
Three Scenario Sensitivity Test
Real estate performance shifts based on rent changes, vacancy fluctuations, and expense surprises, so model three scenarios before you buy. Baseline assumes market rent, 6% vacancy, and standard operating expenses as listed above. Conservative scenario reduces rent by 10%, increases vacancy to 10%, and adds a 15% expense buffer for deferred maintenance or tenant damage. Aggressive scenario assumes rent growth of 8% over two years, vacancy at 4%, and operating expenses 5% below budget due to newer systems or stable tenants. Running all three tells you whether the property still cash flows in a downturn and how much upside exists if conditions improve.
| Neighborhood | Baseline CoC | Conservative CoC | Aggressive CoC |
|---|---|---|---|
| Midtown | 2.8% | 0.4% | 5.1% |
| Decatur | 3.5% | 1.2% | 6.0% |
| West End | 6.2% | 3.8% | 8.9% |
West End delivers the highest baseline and aggressive CoC returns because lower purchase prices magnify the percentage return on your down payment, even with moderately higher vacancy and maintenance. Decatur offers moderate CoC with the strongest downside protection, since conservative scenario returns stay positive due to low vacancy and stable tenant demand. Midtown shows the lowest CoC returns across all scenarios because high purchase prices and HOA fees compress cash flow, but appreciation and low vacancy risk make it a long-term wealth builder rather than a monthly-income generator. Before you commit capital, run your own numbers using current mortgage rates, your actual down payment, and property-specific expense estimates. These examples are illustrative. Your loan structure and tenant mix will shift results.
Risk Assessment and Investment Strategy Fit for Midtown, Decatur, and West End

Each neighborhood carries a distinct risk profile that should match your investment timeline and tolerance for volatility. Midtown’s primary risk is high acquisition cost, which amplifies exposure if the market softens or your personal finances shift and you need to sell quickly. If property values drop 5% to 10% during a broader downturn, your equity cushion evaporates faster in a $450,000 condo than in a $245,000 West End home. Midtown’s deep tenant pool and employment density provide downside protection, since rental demand stays resilient even when sales activity slows. Midtown fits investors who want stability, liquidity, and long-term appreciation over immediate cash flow, and who can weather short-term market cycles without forced liquidation.
Decatur offers the lowest overall risk among the three neighborhoods due to school-driven demand stability and family-oriented tenant base. Vacancy exposure is minimal, property values have appreciated steadily without sharp boom-bust cycles, and the tenant pool tends to maintain properties well and renew leases. The primary risk in Decatur is slower rent growth, since family budgets are more sensitive to annual increases and pushing too hard can trigger turnover. Decatur suits buy-and-hold investors who want predictable cash flow, low operational stress, and moderate appreciation without the redevelopment volatility seen in West End or the high entry cost of Midtown.
West End carries the highest upside potential and the highest short-term volatility. Redevelopment momentum can stall if city investment slows, affordability preservation policies tighten, or broader economic conditions reduce development activity. Neighborhood perception still varies block by block. Vacancy risk is moderately higher than Midtown or Decatur, and tenant turnover can be more frequent as the demographic mix shifts. If BeltLine expansion and retail development continue on pace, West End properties will appreciate faster than either Midtown or Decatur over the next five to seven years, and the higher cash on cash returns reward investors who accept near-term operational friction. West End fits investors with longer time horizons, tolerance for hands-on management or higher property management involvement, and appetite for gentrification upside.
Investor profile and neighborhood fit:
Cash flow focused, higher risk tolerance investors: West End offers the strongest CoC returns and appreciation upside, paired with moderate vacancy exposure and hands-on management needs.
Stability and wealth building investors: Decatur delivers low vacancy, steady appreciation, and minimal operational stress, ideal for first-time landlords or investors who want predictability.
Appreciation and liquidity focused investors: Midtown provides dense tenant demand, strong long-term value growth, and high resale liquidity, accepting lower immediate cash flow for capital gain accumulation.
The right choice depends on whether you value monthly cash flow, long-term appreciation, operational simplicity, or some combination of the three. Running your own sensitivity scenarios, visiting neighborhoods during different times of day, and speaking with property managers who operate in all three areas will clarify which risk-reward tradeoff aligns with your financial goals and timeline.
Expert Tips for Improving Rental Yield in Any Atlanta Neighborhood

Rental yield starts with pricing strategy and tenant selection. Research comparable listings on Zillow, Apartments.com, and local property management sites to confirm market rent, then price your unit at or slightly below the median to minimize vacancy. Over pricing by $100 per month to chase extra income often costs you two to three weeks of vacancy, erasing the annual premium. Screen tenants carefully. Verify income at least 3x monthly rent, run credit and background checks, and call prior landlords to confirm payment history and property care. A stable tenant who renews saves you turnover costs and vacancy gaps that far exceed the benefit of squeezing rent by 5%. Allow pets with a reasonable monthly pet rent (typically $25 to $50 per pet) to expand your tenant pool, since pet-friendly rentals lease faster and command slight premiums in all three neighborhoods.
Control operating costs by budgeting preventive maintenance and addressing small repairs before they become capital expenses. Replace HVAC filters quarterly, service heating and cooling systems annually, and inspect plumbing, electrical, and roof condition every two years to catch issues early. In older West End homes, budget an extra 0.5% to 1% of property value annually for deferred maintenance surprises. Consider a home warranty policy that covers major systems for $500 to $800 per year, reducing your out-of-pocket exposure when appliances or HVAC fail. Negotiate property management fees if you own multiple units or can commit to a multi-year contract. Some managers will reduce their percentage by 1% to 2% in exchange for guaranteed volume or longer terms.
Five actionable strategies to improve rental yield:
Target renovation ROI carefully: Focus upgrades on kitchens and bathrooms, which tenants notice first. In Midtown, stainless appliances and quartz counters justify $100 to $150 monthly rent premiums. In West End, fresh paint, updated flooring, and modern light fixtures generate stronger returns than high-end finishes.
Reduce vacancy with professional marketing: Hire a photographer for listing photos, write detailed descriptions that highlight proximity to MARTA, BeltLine, schools, or employers, and respond to inquiries within two hours to capture motivated tenants before competitors do.
Encourage lease renewals with modest increases: Offer tenants a 2% to 4% rent increase at renewal rather than pushing to market rent, since the cost of turnover (cleaning, repairs, vacancy, marketing) often exceeds the income you gain from a 6% to 8% bump.
Automate rent collection and late fee enforcement: Use online payment platforms like Zelle, Venmo, or property management software to streamline rent collection. Enforce late fees consistently (typically $50 to $75 after a five-day grace period) to train tenants that on-time payment is non-negotiable.
Evaluate property management value vs. self management: If your time is worth more than the 8% to 10% management fee and you own property outside Metro Atlanta or lack local maintenance contacts, professional management protects cash flow and reduces stress, improving your overall return by minimizing costly mistakes and tenant-relations friction.
Final Words
In the action you saw how purchase price, monthly rent, cap rates, and vacancy together shape rental yields across Midtown, Decatur, and West End.
We also covered demand drivers, occupancy patterns, long‑term appreciation, expense pressure, ROI modeling, and which risks match which investor types — plus practical tips to improve net yield.
Use the Investing in Atlanta rental yield comparison by neighborhood Midtown Decatur West End to decide whether you want cash‑flow, appreciation, or a hybrid. Start small, run the numbers, and feel confident about the next steps.
FAQ
Q: What is the 2% rule for rentals?
A: The 2% rule for rentals is a quick guideline saying monthly rent should be about 2% of purchase price to help cash flow; in Atlanta it’s uncommon except for low-priced or distressed buys.
Q: What is the 3-3-3 rule in real estate?
A: The 3-3-3 rule in real estate is a loose budgeting guideline: plan for roughly 3% down, about 3% in closing costs, and three months of mortgage reserves—confirm specifics with your lender.
Q: What part of Atlanta to stay away from?
A: Parts of Atlanta to stay away from depend on crime trends, commute, and personal comfort; check up-to-date crime maps, visit at night, and ask a local agent about specific blocks before deciding.
Q: Is rent dropping in Atlanta?
A: Rent in Atlanta is showing modest cooling in some submarkets in 2023–2024, while high-demand pockets like Midtown and Decatur remain firm; neighborhood, new supply, and jobs shape trends.